Donation trends in Japan ②: Donation patterns and amount (Giving Japan 2015) Reports
Posted on June 07, 2016
by Giving Japan
43.6% of people donated money and 24.6% of people donated goods. More than half make a donation a year.
Throughout 2014, individuals who made a monetary donation account for 43.6%, and individuals who made either a monetary donation or membership fees (31.6%) which is substantially considered as donation account for 49.0% (Fig. 1-1). Individuals who donated goods account for 24.6%. Individuals who made both a monetary and goods donation account for 17.2%, and individuals who made either a monetary or goods donation account for 51.1% (Fig. 1-2). Compared to 2012, monetary donations decreased by 8% and goods donations decreased by 3%.
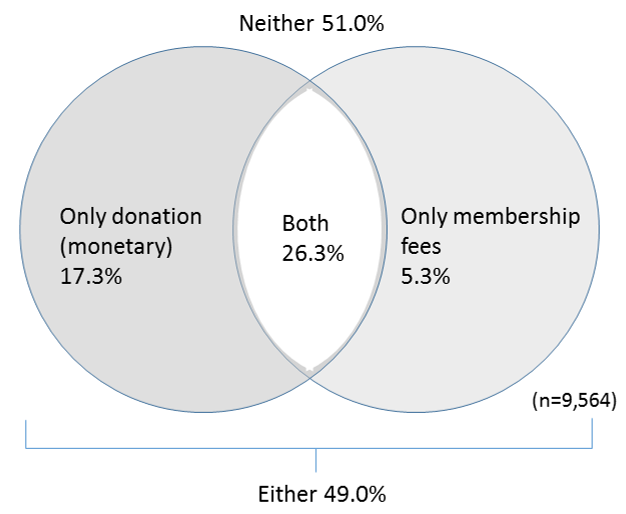 Fig.1-1 Relation between donation (monetary) and membership fees
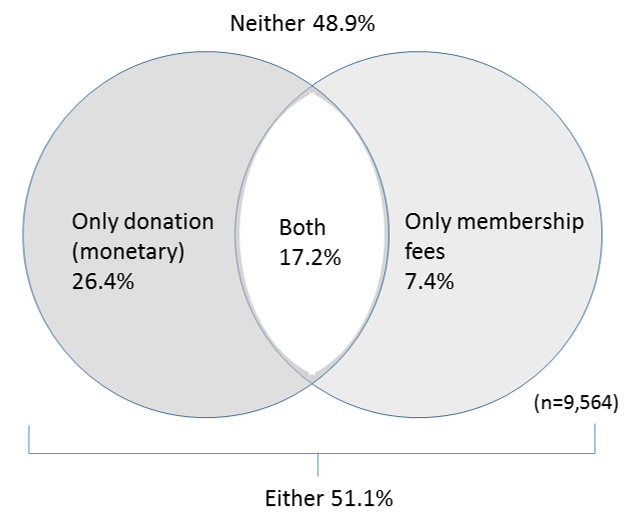 Fig.1-2 Relation between donation (monetary) and goods donation
The average amount of donation made by an individual in 2014 was ¥17,215 per person, which is a significant increase from ¥15,457 in 2012, however, the median of donation amount remained the same to be ¥2,300 (Table 1-2).
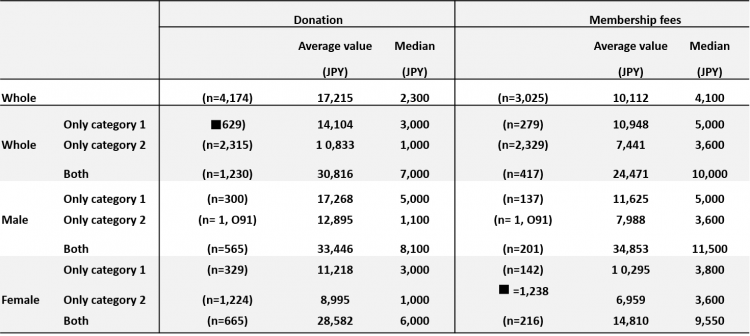 Table 1-2 The average donation and membership fees by category (gender)
The donor ratio by category, “Community Chest Association” is more than 60%, by far the highest, followed by the “Japanese Red Cross Society” and “neighborhood association/community activities, etc.” As for membership fees, “neighborhood council & association, etc.” marks as high as over 80%, followed by the “Japanese Red Cross Society” (Fig. 1-3).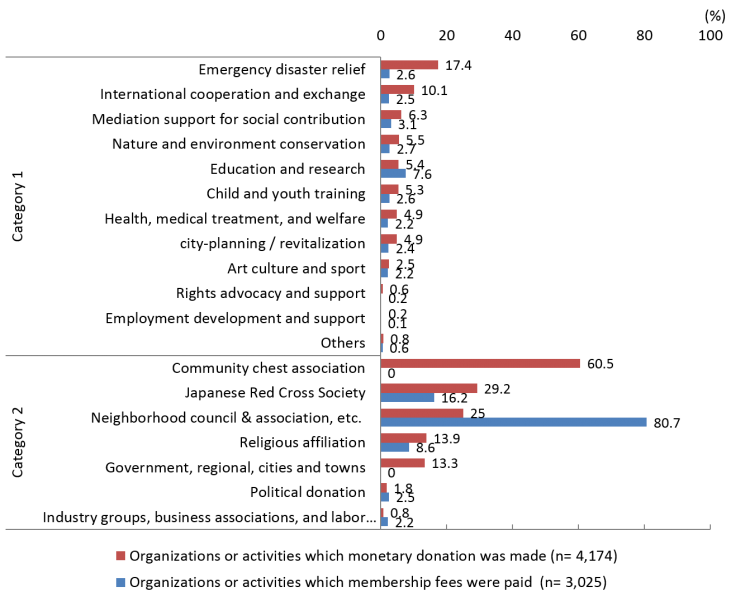 Fig.1-3 Rate of donors by category (multiple answers)
In analyzing characteristics of each category, we have decided to divide the category of organization and activity roughly into two types, and roughly to analyze tendency this time since otherwise under the classification at the time of survey as it would only describe categories that have many donors. They are “Category 1” that includes NPOs and various civic activities such as international cooperation/exchange, and emergency disaster relief, and “Category 2” that includes neighborhood council & association activities and religious activities. This has revealed that those who made a donation only to “Category 1” account for 29.5%; those who made a donation only to “Category 2” account for 55.5%; and those who made a donation to “both categories” account for 15.1% (Fig. 1-4). Within age group, those who made a donation only to “Category 2” is the highest at every age group; however, the ratio of donors who made a contribution only to “Category 1” is higher at their 20s than that of other age groups (Table 1-1). Moreover, for the average donation amount and the median, those who made a donation either only to “Category 1” or “both” donate more when donors who are 40 years and above (Table 1-3).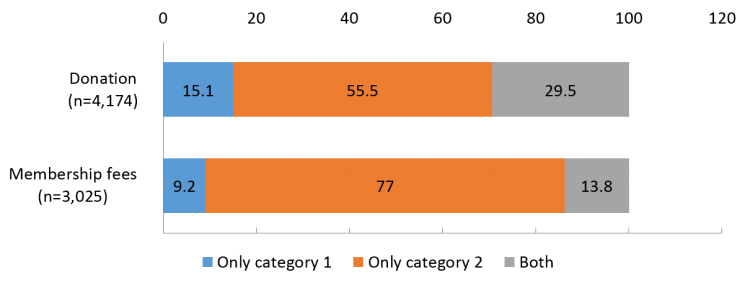 Fig.1-4 The breakdown of donors by category
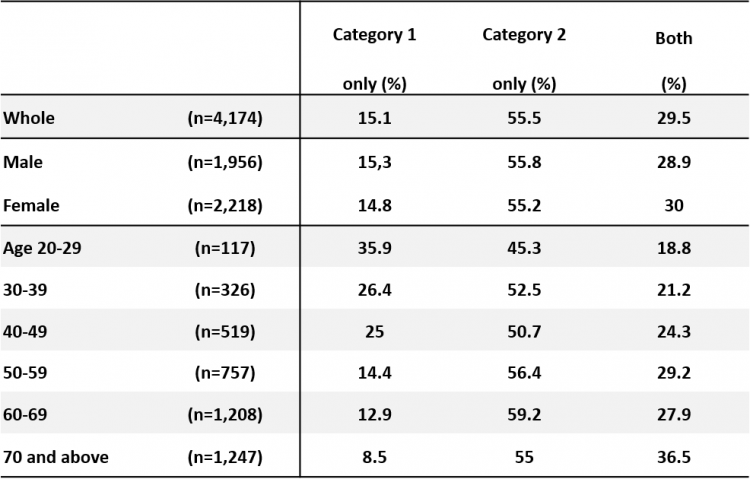 Table 1-1 The breakdown of donors by category (gender / age group)
 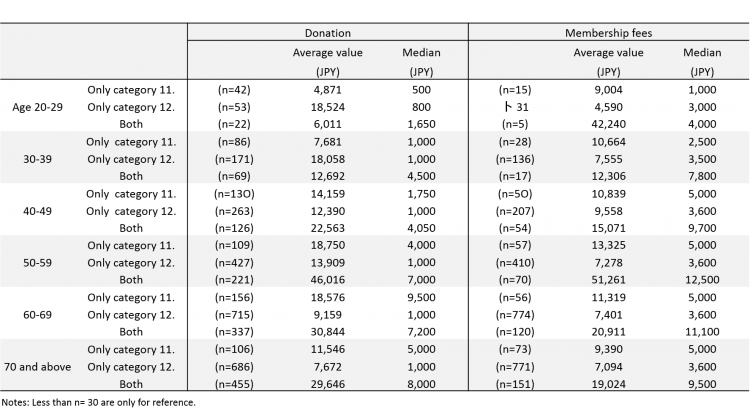 Table 1-3 The average donation and membership fees by category (by age group)
Table of Contents
- Index
- 43.6% of people donated money and 24.6% of people donated goods. More than half make a donation a year.
- Four years from the Fukushima earthquake disaster – Donors remains as 40% and the total amount of donations was increased to ¥740,900 million.
- 47.1% of female, 40.3% of male make a donation. More than half of people aged 60 and over make a donation.
- Online donation increases slightly. “Hometown tax donation” and “Gifts with donation” are expected to see a future increase as more people showed an interest.
- “Sympathy to organization” and “Social contribution awareness” are particularly high with donors who make a donation of ¥50,000 or more.
- Important criteria for donors to consider when making a donation – “the use of monetary donation,” “the meaning/purpose of the activity,” etc. ranked high. Those two are viewed more important by donors who have an organization that they wish to support than those who don’t.
- Corporate donation is ¥698,600 million (2013 fiscal year) and 16.2% of all the corporations has reported as donation expenditures.
- Donations are certainly gaining its momentum.
Recent Articles
- A Place where People with Difficulties in Life Can Support Each Other: Valuing Loose Connections
- How They Give is Changing and the Implications for Japan’s Nonprofit Sector
- What Local NPOs Can Do to Prepare for the Next Disaster – Proposals from the 311 Change Association
- Should Only Education in School Count? ~ How Can We Protect the Dignity of Citizens? The Value of Civic Engagement is Questioned.
- Latest of the 20-year-old Tsutaeru Kotsu (Communication Tips) Series of Seminars Was Held
- Participants of Connected Disaster Prevention Program has exceeded 12,000